|
Schaller Consulting |  |
| Home | New Mobility | Taxi, Traffic & Transit (Archive) |
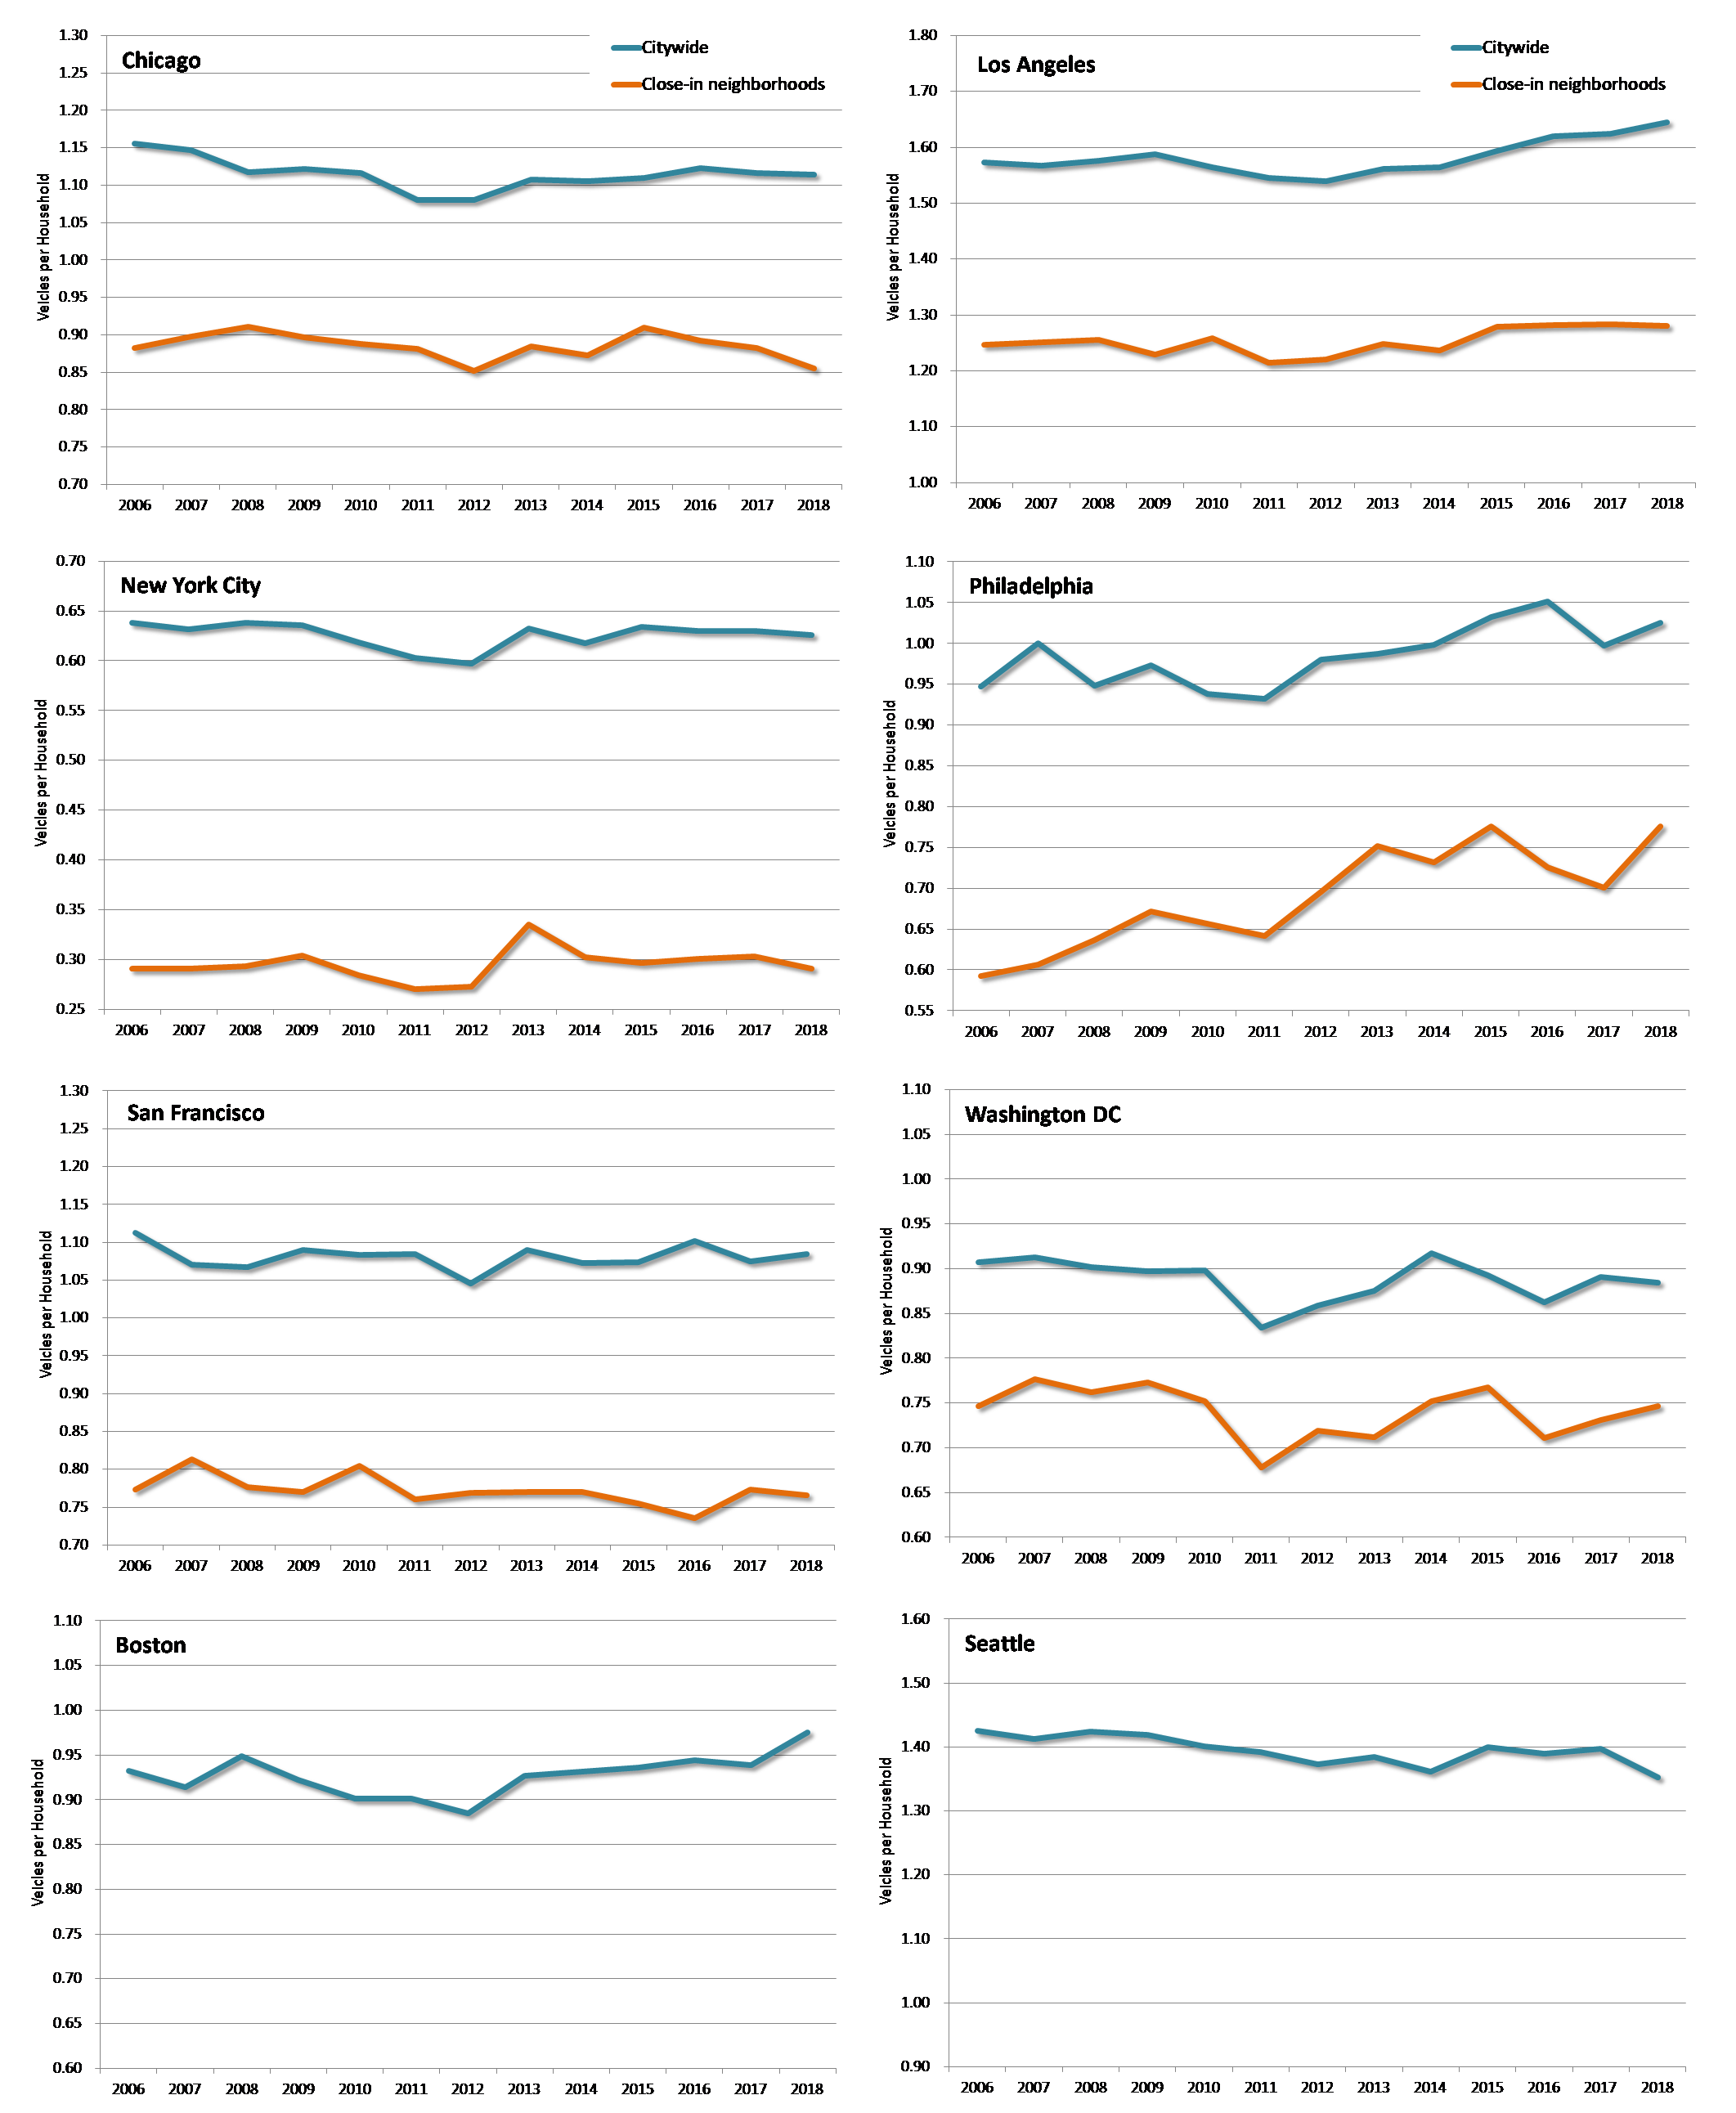
It turned out that what both drivers and passengers really wanted was something more taxi-like. The initial “voluntary donation” to help cover gas and maintenance was replaced by fares set by the companies. Users of the new services split into two groups: drivers who sometimes made this into a full-time job, and passengers who wanted to socialize less than they wanted to get from A to B. The shift was made official when Lyft passengers moved from sitting in the front seat after a fist bump, to the back seat like taxi passengers. When “rideshare” became a more reliable version of traditional taxi service, it was unable to fulfill promises of reducing traffic. The rapid growth of Uber and Lyft added to traffic if only because there was “deadhead” mileage between each drop-off and the next passenger pickup. Moreover, passengers commonly left the bus or train behind rather than leaving their personal car in the driveway. Still, the companies claimed that once they got their true rideshare or “pooled” services up and running, the result would be reduced traffic. When most people shunned pooled options like UberPool and Lyft Line in favor of the initial solo-ride service, the companies claimed that ride-hail use itself would lead people would make fewer auto trips because of an overall shift in their travel habits. The new idea was this: ride-hail along with other new mobility options such as bike share and shared electric scooters would be the last piece of the puzzle to move urban households toward having fewer or no personal vehicles. Yes, they would use the solo-ride Uber and Lyft services, but other trips would switch from their own car to transit, walking and biking. It has been hard to check that claim on an individual basis because people add or subtract from their vehicle holdings for myriad reasons. However, what we really care about is whether household car ownership as a whole is going up or down. For that, we have good data. If car ownership was declining as a result of ride-hail, one would expect to see drops in car ownership in the cities and neighborhoods where people use Uber and Lyft most frequently. Thus, we should look at car ownership in those cities, e.g., San Francisco, Washington DC, Boston, Chicago, Seattle, Philadelphia, New York, and Los Angeles. We would also expect greater declines in vehicle ownership in the parts of these cities where Uber and Lyft ridership is most concentrated. That would be in the very core neighborhoods – downtown areas and immediately surrounding neighborhoods with the modal ride-hail user: young, educated and affluent. The figure below shows trendlines in household vehicle ownership since 2006, using the Census Bureau’s American Community Survey (ACS).
Household Vehicle Ownership in Eight Large Cities, 2006-18 Sources: U.S. Census Bureau American Community Survey; Ruggles, S., S. Flood, R. Goeken, J. Grover, E. Meyer, J. Pacas and M. Sobek (2019) IPUMS USA: Version 9.0, IPUMS. Sub-city geography not available for Boston and Seattle. The first thing that is evident is that vehicle ownership rates are lower in close-in neighborhoods than citywide, reflecting greater availability of public transportation, greater density of destinations within walking distance of residents’ homes and businesses, and the scarcity and cost of parking. Second, car ownership rates declined after the 2008 fiscal crisis and then increased between approximately 2011 and 2015 (the years vary by city). This pattern is seen in both citywide and close-in neighborhood trendlines. Clearly, fluctuations in car ownership are closely related to the economic cycle. Third, while close-in neighborhoods have much higher usage of ride-hail than these cities a whole, the trendlines match very closely. This suggests that factors not related to ride-hail usage are driving changes in car ownership over the past dozen years. Finally, car ownership rates are generally about the same in 2016-18 and 2006-08. Taking into account the margin of error in the ACS data, only Los Angeles shows consistently higher car ownership in 2016-18 than in the mid-2000s. No city shows reductions in car ownership that exceed the ACS margin of error between the mid-2000s and three most recent years. To be sure, these are aggregate data and likely miss nuances of individual household behavior. However, the evidence in these data certainly fails to support the proposition that ride-hail has produced lower levels of vehicle ownership. Rather, these trends tend to suggest that the influx of ride-hail and other new mobility options has not translated to lower vehicle ownership rates.
|